


January 30, 2026
American Lifestyle Trends 2026: The Big Shifts to Watch

January 20, 2026
What Does an AMBER Alert Mean and How Should You Respond?


October 23, 2025
How to Verify a News Story

October 29, 2025
Family-Friendly Streaming Picks for Busy Weeknights
November 5, 2025
Overtime Rules: NFL vs College (Simple

November 6, 2025
Gas Budget Planner: Turn Prices into

November 10, 2025
AI in Plain English: What “Tokens”

November 11, 2025
Apartment Move-In Checklist (Print & Go)

December 3, 2025
Why Handwritten Thank-You Notes Still Matter

December 10, 2025
How to Read a Government Press

Business
January 2, 2026
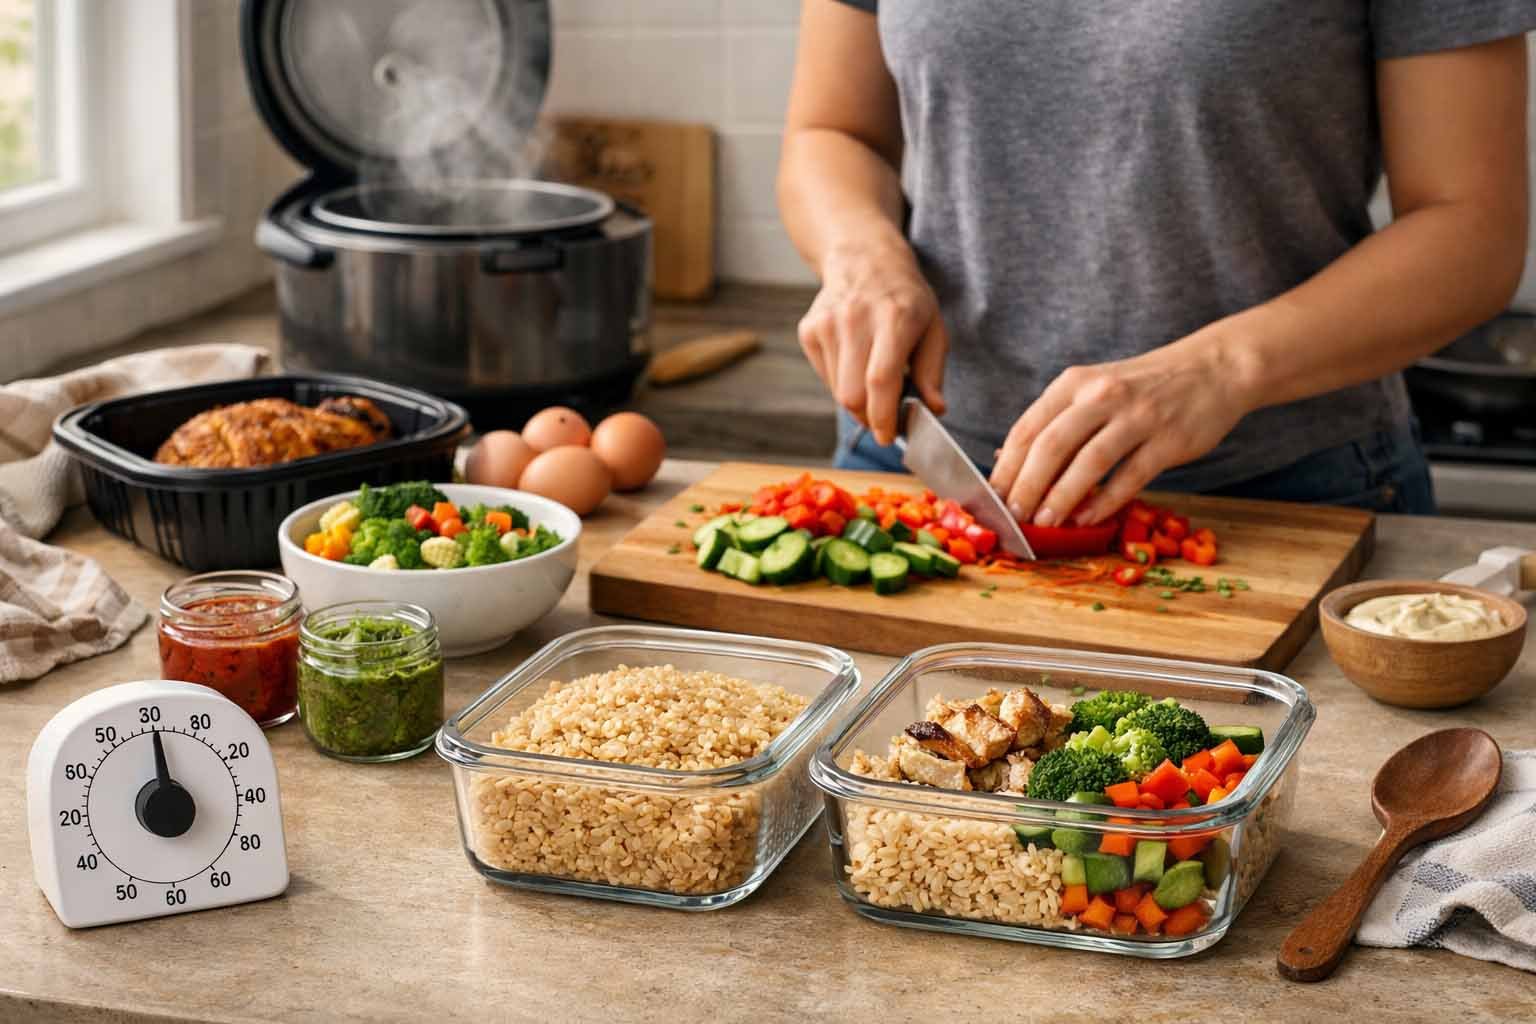
Easy Meal Prep for One: A
Disclaimer: This article is for general educational purposes only and does not provide medical, nutrition, or health advice. For personalized guidance, consult a qualified professional. I used to think cooking

January 3, 2026
Password Manager Setup Guide: Secure Your

January 5, 2026
Small Business Startup Checklist for First-Time
January 8, 2026
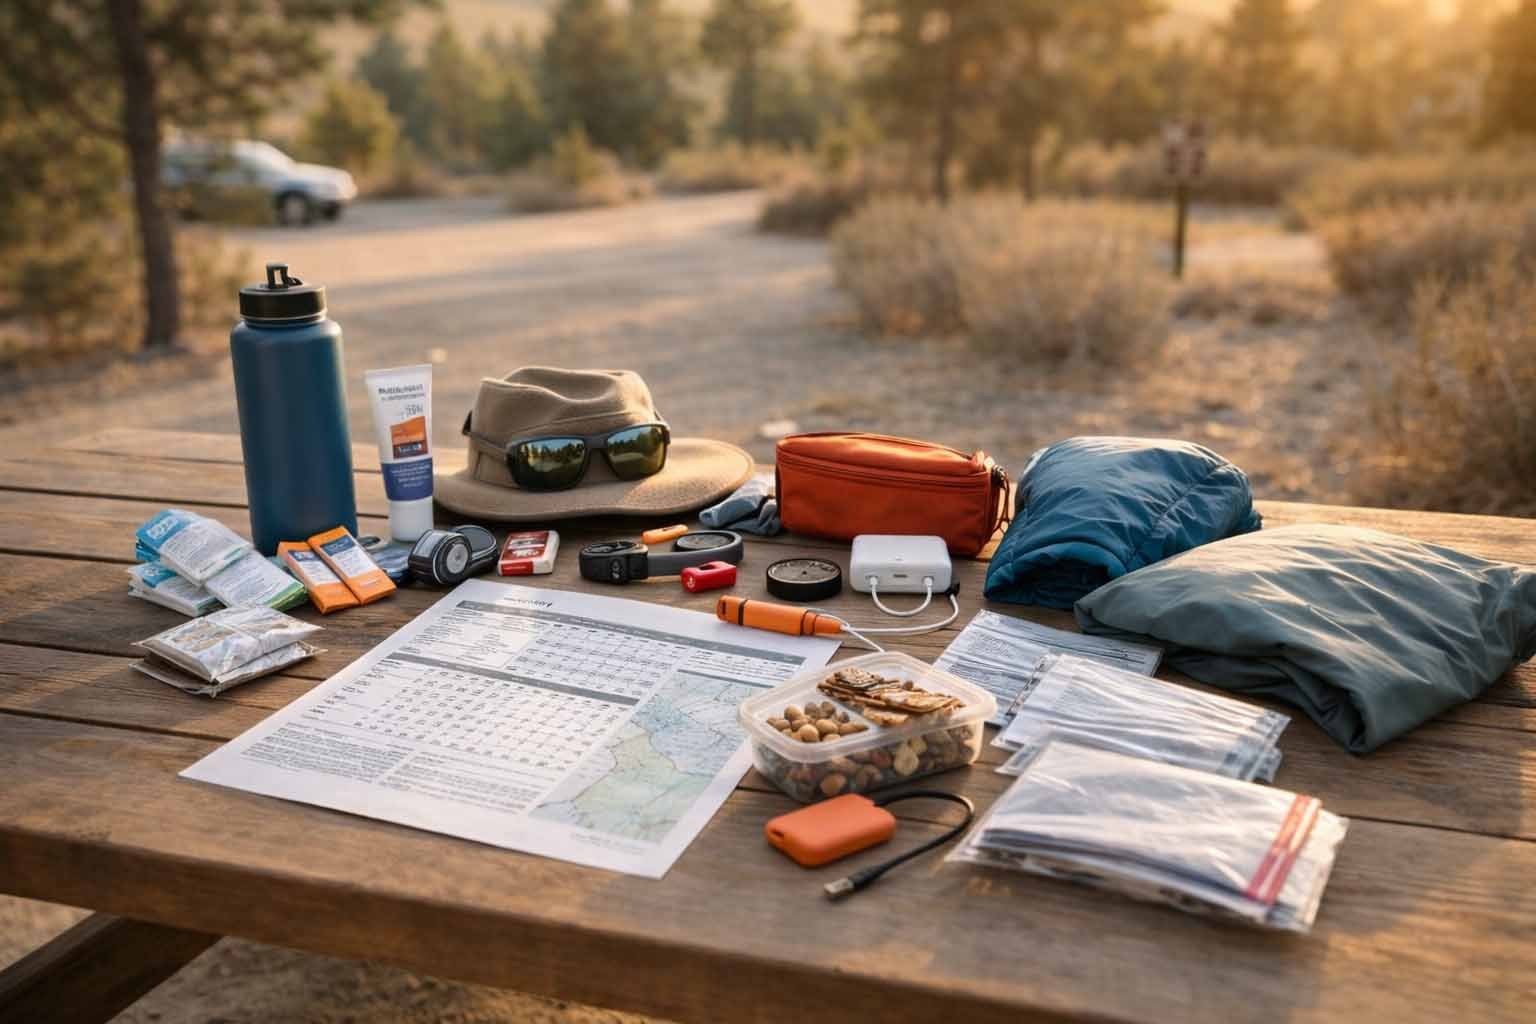
National Park Packing List on a


Featured Stories
America Now (Trending News + Politics)
America Now (Trending News + Politics)
How to Verify a News Story in 60
Author experience: I verify breaking stories every day with
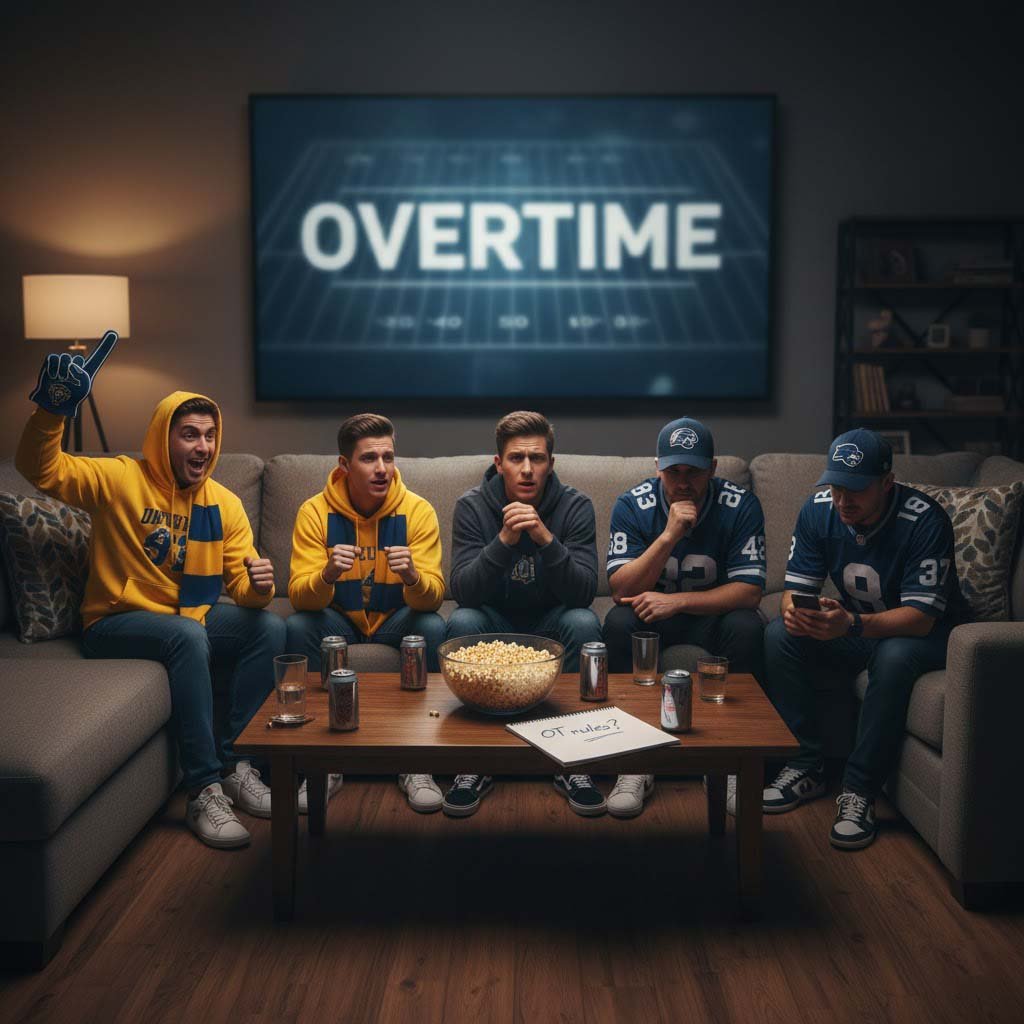
Game Day USA (Sports)
Game Day USA (Sports)
Overtime Rules: NFL vs College (Simple Fan Guide)
Disclaimer: This guide is for general information only and
American Voices (Opinions & Editorials)
American Voices (Opinions & Editorials)
Why Handwritten Thank-You Notes Still Matter
Disclaimer: This article is for general educational purposes and
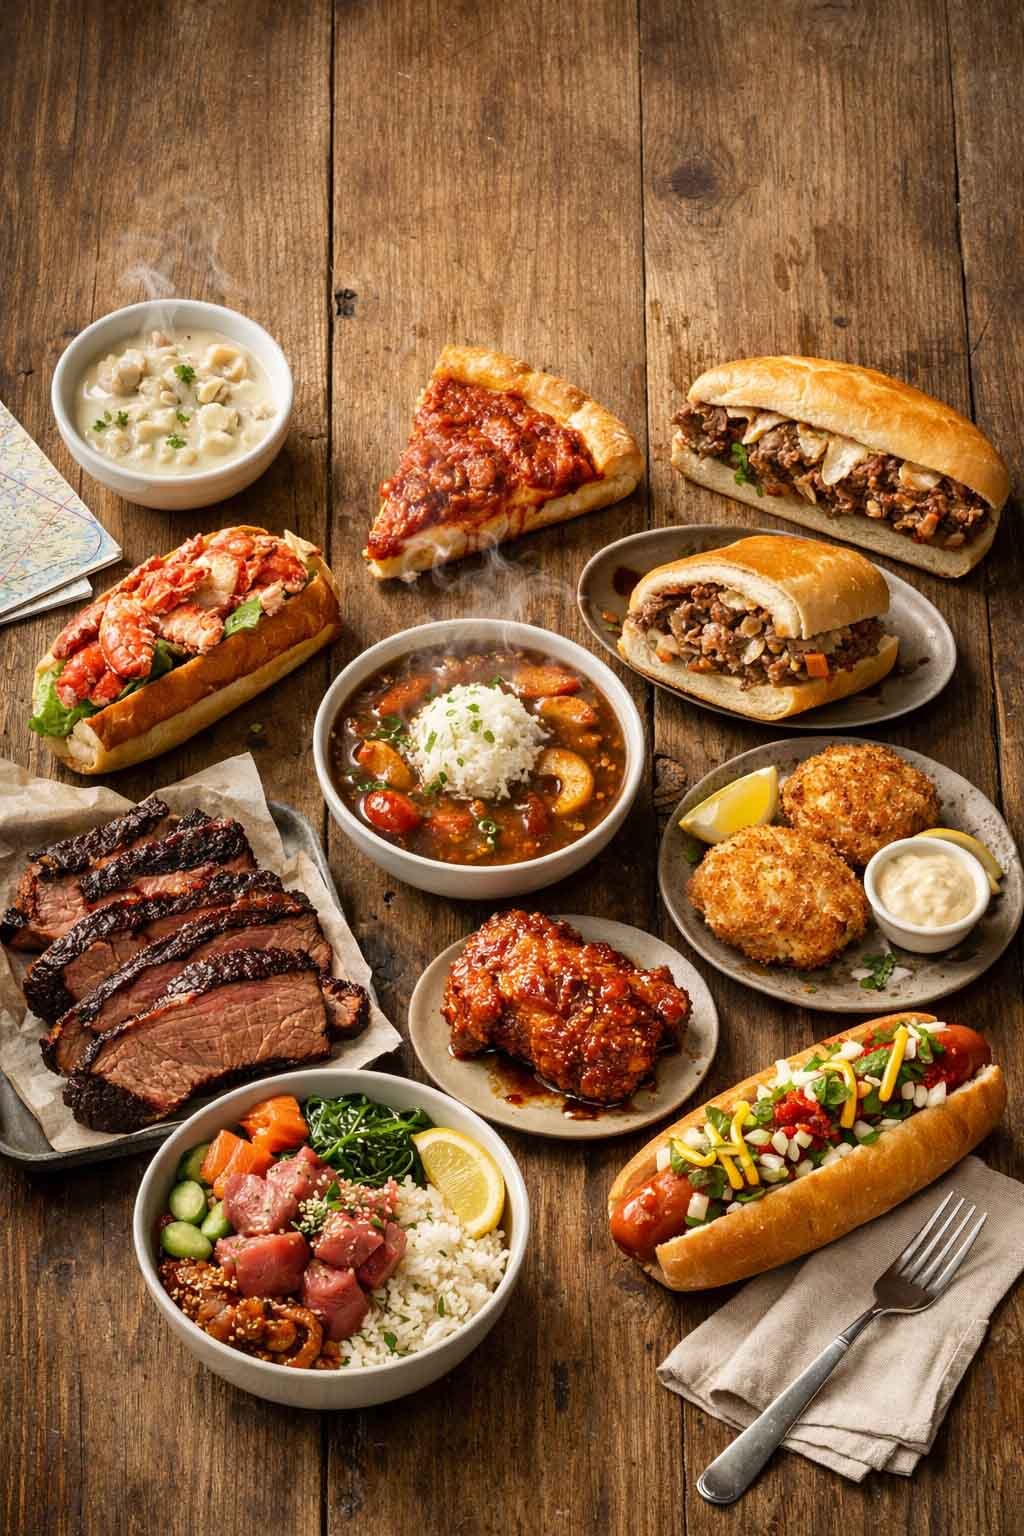
Tastes of America (Food & Recipes)
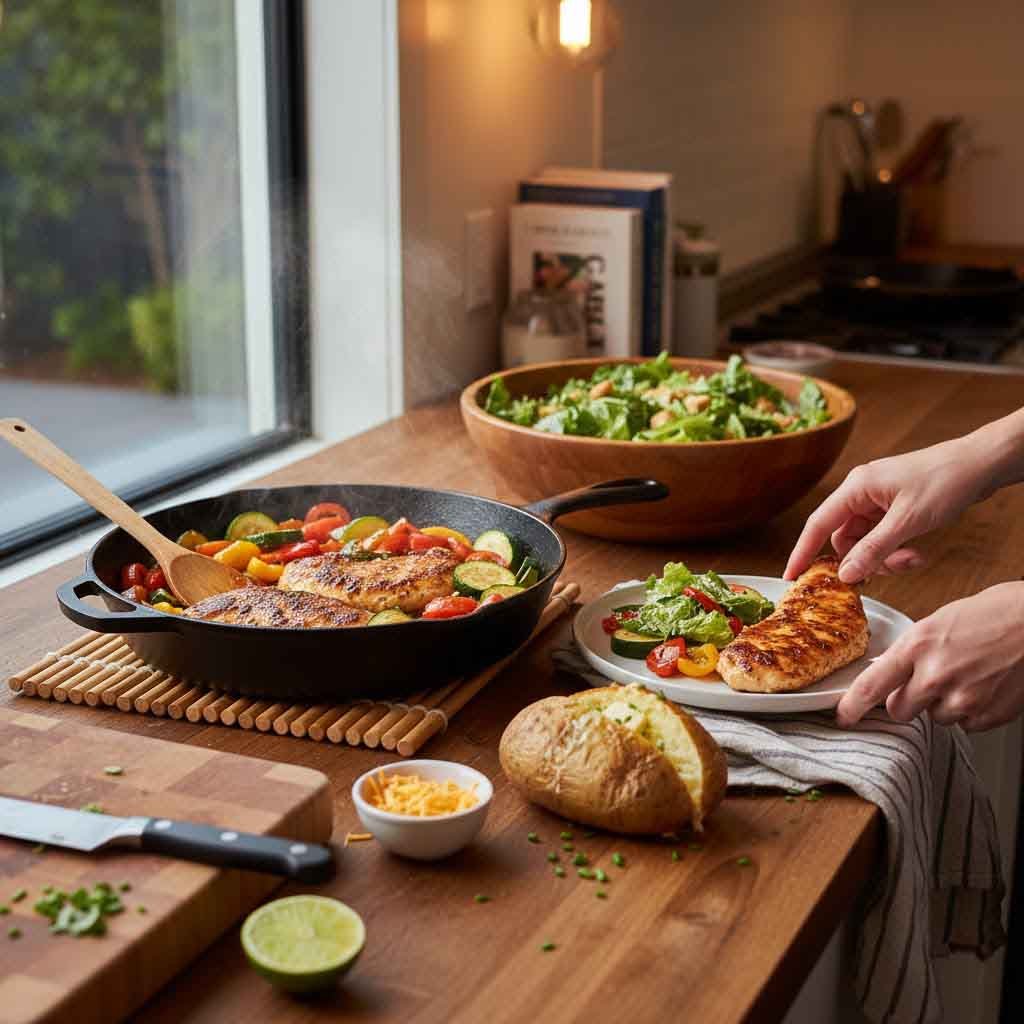
Tastes of America (Food & Recipes)
Easy American Weeknight Dinners Ready in 20 Minutes
Disclaimer: This article is for general informational purposes only.