





Disclaimer: This article is for educational purposes only. Statistics and box score formats may vary slightly by platform, and nothing here should be considered official scoring guidance or professional advice.
A box score can look like alphabet soup the first time someone sees it. But once the logic clicks, it becomes one of the fastest ways to understand what actually happened in a game who created runs, who prevented runs, and where the game turned.
In this guide, it’s explained how to read a baseball box score like a fan who genuinely follows the story, without needing a stats degree.
The approach is built from real-world viewing habits: comparing MLB Gameday screens with old-school printed boxes, pausing MLB Network highlights, and using the box as a “game recap table reading” tool rather than a wall of numbers.
This is a practical baseball stat abbreviations guide with a beginner-first structure, plus a simple way to decode common scorekeeping symbols so the page stops feeling intimidating.
What a Box Score Is (and What It Isn’t)
A box score as a “compressed story” of the game
A box score is a compact summary of four things, all in one place:
- Scoring: when runs crossed and how the game flowed.
- Batting: who reached base, who drove in runs, who hit for power.
- Pitching: who limited damage, who struggled, and how the bullpen was used.
- Fielding: the defensive plays and mistakes that changed innings.
It shows up everywhere sports apps, newspaper recaps, team sites, and broadcast graphics. On TV, you’ll often see a simplified version, but the “full” version contains the details that explain why the final score happened.
Where box scores come from (quick authority context)
Box scores don’t appear by magic. They’re built from official scoring and standardized record-keeping:
- Official Baseball Rules (OBR) provide the scoring framework what counts as a hit, an error, an earned run, and so on.
- Elias Sports Bureau is widely associated with official stat services and game record integrity at the pro level.
- Retrosheet preserves historical game logs and play-by-play for research and learning.
- Society for American Baseball Research (SABR) helps fans and researchers understand baseball history, data, and context.
The key takeaway: the box score is not a “hot take.” It’s a structured record designed to be consistent.
How to Read a Baseball Box Score in the Right Order (Beginner Flow)
A beginner gets good fast by reading in a consistent sequence. The method below is a “top-to-bottom” habit that keeps the brain from bouncing between abbreviations.
A simple top-to-bottom method (built from real viewing habits)
Step 1: Start with the line score breakdown.
This reveals the inning flow and the turning points.
Step 2: Confirm team totals interpretation.
Runs, hits, and errors give a reality check on what the game felt like.
Step 3: Move to the offense section: batting line explained.
This identifies which hitters actually created scoring pressure.
Step 4: Read the mound section: pitching line explained.
This shows whether the game was controlled by starters, relievers, or chaos.
Step 5: Finish with defense: fielding line explained, plus notes.
This is where “how it happened” often lives errors, double plays, substitutions, and positional context.
Why this order works for new fans
- It prevents getting lost in abbreviations too early.
- It mirrors how highlight packages tell the story: “What happened first?” → “Who did it?” → “Who shut it down?” → “What mistakes or key plays mattered?”
The Line Score Breakdown: Inning-by-Inning Storytelling
How the line score is laid out
The line score is usually presented with the visiting team on top and the home team below. Each inning is a column, and the final columns show totals. Think of it as the timeline of the game.
Inning-by-inning scoring summary: how to interpret swings
An inning-by-inning scoring summary answers three questions quickly:
- Did one inning decide the game?
- Was there a comeback inning?
- Were there late “insurance” runs that changed strategy?
A beginner doesn’t need to memorize every play. The point is to spot momentum shifts and identify when pitching decisions probably changed.
Practical example walkthrough (hypothetical)
Imagine a simple line score where the visiting team scores early, the home team answers with a big middle inning, and the visitors tack on a late run:
- Visitors: 2 runs in the 2nd, 1 run in the 8th
- Home: 4 runs in the 5th
Even before reading names, the story appears: early pressure, a decisive middle inning, then late tension. This is why the line score is the best first scan before diving into who had which hit.
Team Totals Interpretation: Runs, Hits, Errors (and Why They Matter)
R, H, E as the quickest “health check”
Most box scores summarize team totals as R, H, and E:
- R (Runs): the only total that determines the winner.
- H (Hits): how often a team produced a hit (not the same as “how many base runners”).
- E (Errors): defensive mistakes that extend innings or give free bases.
When totals can mislead (a practical observation)
A common surprise for new fans: the team with fewer hits can still outscore the other team. That usually happens through walks, power hits, and timely sequencing. A three-run homer changes a game faster than three scattered singles.
Error types and responsibility (beginner-safe)
Errors are scored based on whether an average fielder “should” make the play. The error types and responsibility concept matters because mistakes can:
- Extend innings (more chances for runs)
- Change how pitching outcomes are recorded later
That connects directly to the pitching section, where earned vs unearned runs are tracked.
Batting Line Explained: The Offense Section Made Simple
The core batting columns beginners see most
In the batting section, these appear constantly:
- AB (At Bats)
- PA (Plate Appearances)
- RBI (Runs Batted In)
- BB (Walks) and IBB (Intentional Walk)
- SO (Strikeouts)
The easiest beginner move: read batting lines like a checklist who reached base, who hit for power, who drove runs in.
Plate appearance components: what “counts” and what doesn’t
A beginner often asks why AB and PA differ. The answer is plate appearance components:
- HBP (Hit By Pitch) puts a hitter on base but typically doesn’t count as an at-bat.
- SF (Sacrifice Fly) can drive in a run without counting as an at-bat.
- SH (Sacrifice Hit / bunt) is another way to advance runners, again affecting the accounting.
This is also where hit-by-pitch notation becomes relevant some box scores list it as a simple “HBP” count, others highlight it in notes.
Hits in detail: 1B, 2B, 3B, HR (extra-base hit types)
The four hit types are:
- 1B single
- 2B double
- 3B triple
- HR home run
These are the most common “power signals,” especially extra-base hit types (2B/3B/HR). Many boxes also show TB (Total Bases), which is a quick way to see whether a hitter’s night was mostly singles or real damage.
Walk vs intentional walk: why IBB exists
A standard walk is BB. An intentional walk is IBB. The phrase walk vs intentional walk matters because it signals strategy: the defense chose to avoid a matchup, often to set up a double play or face a weaker hitter. It’s a reminder that box scores also reflect decisions, not just outcomes.
Strikeout types: swinging vs looking
Some boxes differentiate strikeout types (swinging vs looking) with different “K” symbols. The point for beginners isn’t to judge the hitter just to understand the box can encode how an out happened.
Sacrifice fly vs sacrifice bunt
The difference between sacrifice fly vs sacrifice bunt is context:
- A sacrifice fly (SF) usually happens on a deep fly ball that scores a runner.
- A sacrifice bunt (SH) moves runners up by giving up an out.
Both are situational tools, and the box score records them because they change runner advancement and run creation.
GDP and why it matters
GDP stands for grounding into a double play. It’s often the fastest rally-killer because it removes two outs at once and can wipe away a runner on base. When the offense seems productive but didn’t score much, GDP is one of the first places to check.
Base Running Lines: SB, CS, and Reading Pressure on the Defense
Stolen base tracking
SB is the stolen base count, and stolen base tracking helps show how aggressively a team pressured the pitcher and catcher. It’s not always “good” on its own, but it signals pace and risk.
Caught stealing tracking
CS records caught stealing. Caught stealing tracking can reveal a key moment: a runner thrown out in a close game can erase a scoring opportunity and shift momentum.
Runners left on base as missed opportunities
LOB captures how many runners were stranded. The concept of runners left on base is a practical shortcut: a high number often means a team created traffic but couldn’t deliver a big hit at the right time.
Pitching Line Explained: Understanding Who Controlled the Game
The pitching columns beginners should focus on
Pitching lines can look intimidating, so beginners should focus on a short core:
- IP (Innings Pitched)
- BF (Batters Faced)
- ER (Earned Runs) and UER (Unearned Runs)
- WHIP (Walks + Hits per Inning Pitched)
- K/BB ratio
- QS (Quality Start)
The term quality start definition is simple: it’s a start where the pitcher worked deep enough and allowed limited damage. It’s not perfect, but it’s an easy “starter did their job” signal.
Innings pitched conversion (outs to decimals)
One of the biggest beginner traps is innings pitched conversion (outs to decimals). In baseball notation:
- 6.1 IP means 6 innings and 1 out
- 6.2 IP means 6 innings and 2 outs
It does not mean “six and a half.” It’s outs, not tenths.
Earned runs vs unearned runs
The phrase earned runs vs unearned runs matters because errors change how runs are attributed. A pitcher might allow base runners after an error that “should have ended the inning.” The box score separates that because it’s trying to reflect responsibility accurately within scoring rules.
Pitch count meaning (when shown)
Some box scores display pitches thrown. Pitch count meaning is straightforward: higher totals often indicate longer at-bats, more base runners, or less efficiency. It’s also a hint about bullpen usage later.
Relief pitcher usage summary
A full box score often reads like a bullpen map. Relief pitcher usage summary helps the reader see whether:
- the starter dominated and handed off late
- the game turned into a bullpen relay
- a specific reliever faced a tough moment and stabilized the inning
Pitcher Decisions: W–L–SV (and the Rules Behind Them)
Win–loss–save decisions: useful, but limited
The category win–loss–save decisions is familiar, but it can be misleading. A pitcher can earn a win with average performance if the offense scores right after they exit, and a dominant reliever might not get a “decision” at all.
For deeper context, many fans compare a standard box score with analysis pages like FanGraphs, but that’s optional. The box already tells a lot.
Pitcher of record rules (beginner-friendly)
Pitcher of record rules explain who gets credited with a win or charged with a loss. A common baseline: starters typically must complete enough innings to qualify for a win, and the lead must be held when control passes to relievers.
Save vs hold differences
A save is often awarded when a pitcher finishes a close game under specific conditions. The phrase save vs hold differences matters because holds (setup work) might not appear in every basic box score, even though they represent meaningful bullpen contribution. Broadcasts and apps may show holds depending on the platform.
Fielding Line Explained: Defense, Errors, and Quiet Value
Why the fielding line is usually short
Many games don’t produce much fielding “accounting” beyond errors. That’s why this section can look empty compared to batting and pitching.
Putouts and assists basics
Two key defensive stats are:
- PO: putouts
- A: assists
The concept putouts and assists basics helps beginners understand that fielders can contribute to outs even if they never touch a ball in the highlight reel. Middle infielders often rack up assists because they relay throws on ground balls.
Errors revisited
Errors matter because they change innings, and they can explain why pitchers show uneven earned/unearned totals. A single defensive mistake can quietly reshape the game.
Notation and the “Hidden Language” in Many Box Scores
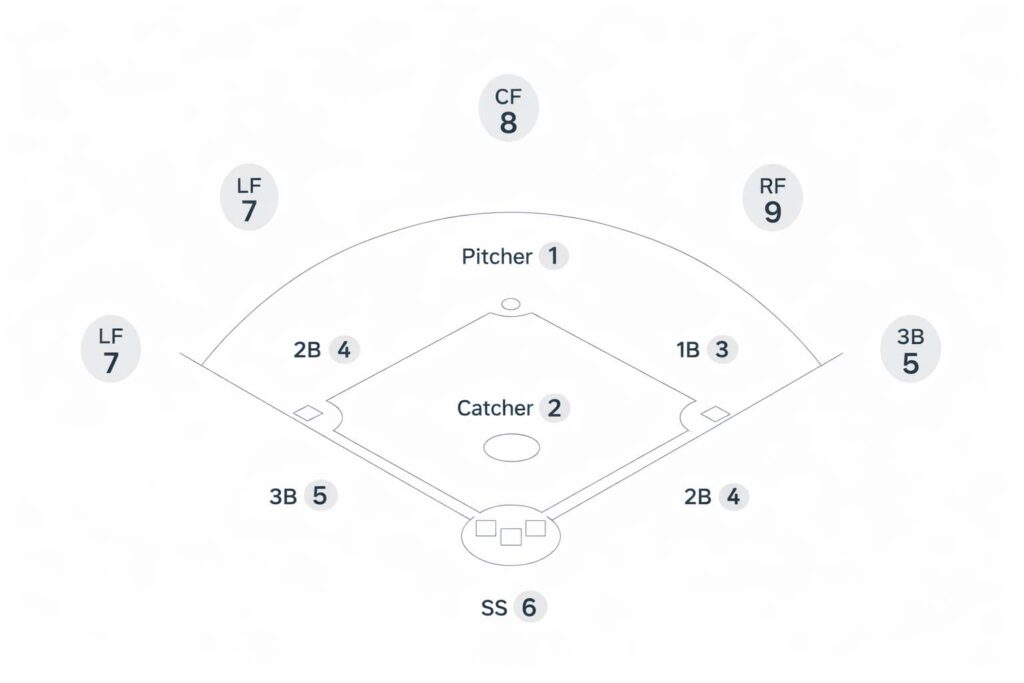
Player position number system
The player position number system is classic scorekeeping shorthand:
1 pitcher, 2 catcher, 3 first base, 4 second base, 5 third base, 6 shortstop, 7 left field, 8 center field, 9 right field.
This matters because many box score notes use these numbers to describe sequences of outs.
Common scorekeeping symbols (a small, useful set)
Every box score includes a few common scorekeeping symbols. Beginners don’t need them all on day one, but recognizing the frequent ones removes anxiety: K for strikeouts, BB for walks, HBP for hit-by-pitch, and DP for double play.
Scoring plays notation
Scoring plays notation describes how runs were produced: “two-run homer,” “RBI single,” “sacrifice fly,” and so on. If the line score shows a big inning, scoring plays notation is where the box explains how it happened.
Double play scoring notation
Double play scoring notation is typically written with position numbers, like 6-4-3, which means shortstop → second base → first base. Reading it left to right shows the ball’s path.
Triple play notation
Triple play notation follows the same logic but is rarer. A sequence like 5-4-3 means third baseman → second baseman → first baseman. It’s rare enough that when it shows up in the notes, it’s worth pausing to appreciate.
Substitutions and Lineup Context (Where Beginners Get Confused)
Starting lineup order
The starting lineup order is the batting sequence from 1 to 9. The top of the order tends to prioritize on-base ability, while the middle emphasizes run production. Even without deep knowledge, noticing where the big hits came from helps the game feel more coherent.
Pinch hitter notation
Pinch hitter notation marks a hitter who bats for someone else, often late in games. If a pinch hitter drives in runs, the box score can show it clearly but only if the reader knows to look for substitution markers.
Defensive substitution notation
Defensive substitution notation appears when teams bring in better late-inning defenders, change positions, or replace a player for matchup reasons. These changes can matter a lot in close games.
Where to Practice Reading Box Scores (Tools and Trusted References)
A beginner workflow that builds confidence
A practical learning routine uses platforms that show the same game in different formats:
- MLB Gameday for play-by-play and inning flow
- Baseball-Reference for a clean traditional box format
- FanGraphs for optional deeper context when curiosity grows
This “compare views” method is how many fans move from confusion to clarity quickly.
Advanced (optional): Statcast context
Statcast adds modern detail exit velocity, launch angle, and batted-ball metrics. It’s not required to understand a box score, but it can explain why a hitter’s line looks “quiet” despite loud contact.
Historical learning for curious fans
For older games, Retrosheet is a gold mine. And for anyone who wants to connect the numbers to baseball history, the National Baseball Hall of Fame and Museum in Cooperstown, New York provides the broader narrative: eras, styles, and how record-keeping shaped the sport.
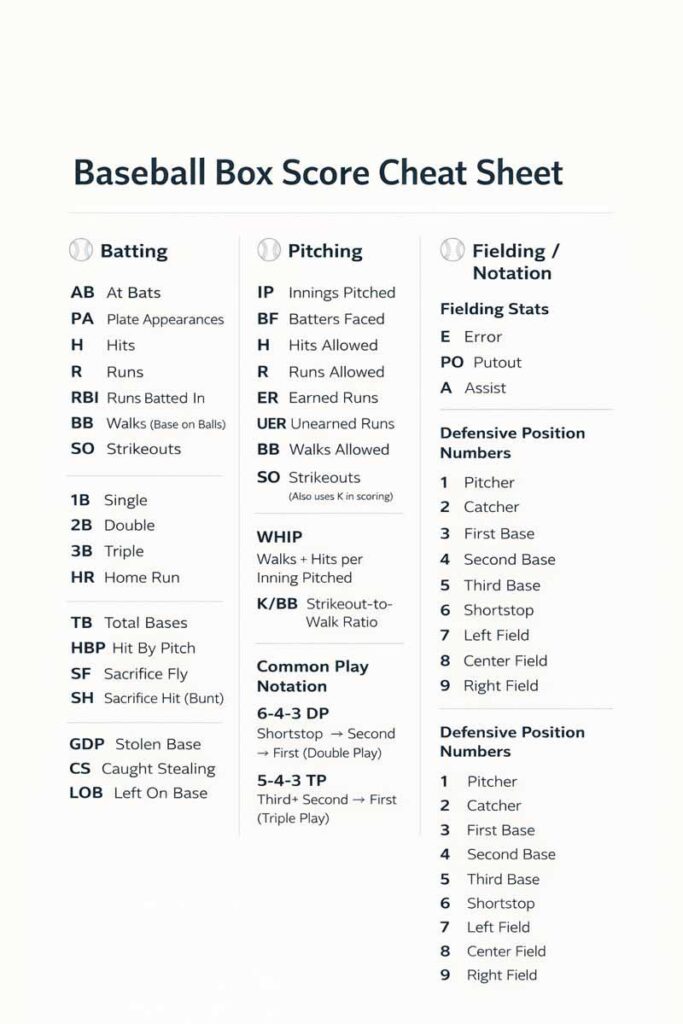
Mini “Cheat Sheet” Section (Printable-Style)
This section is intentionally compact so it can be saved or printed.
Batting cheat sheet (quick definitions)
- AB: official at-bats
- PA: all plate appearances
- R: runs scored
- H: hits
- RBI: runs batted in
- BB: walks
- IBB: intentional walks
- SO: strikeouts
- 1B / 2B / 3B / HR: single, double, triple, home run
- TB: total bases
- HBP: hit by pitch
- SF: sacrifice fly
- SH: sacrifice bunt/hit
- GDP: grounded into double play
- SB: stolen bases
- CS: caught stealing
- LOB: left on base
Pitching cheat sheet (quick definitions)
- IP: innings pitched
- BF: batters faced
- ER: earned runs
- UER: unearned runs
- WHIP: base runners allowed per inning (walks + hits)
- K/BB: strikeout-to-walk ratio
- QS: quality start indicator
- Pitch count: total pitches thrown (if shown)
Fielding and notation cheat sheet
- E: errors
- PO: putouts
- A: assists
- Position numbers: 1–9 defensive shorthand
- DP/TP sequences: read left-to-right as the ball’s path
Common Mistakes Beginners Make (and How to Avoid Them)
Confusing AB with PA
A beginner might think they are the same because both involve stepping into the batter’s box. But PA includes outcomes that don’t count as at-bats, like walks and sacrifice plays. The fastest correction is to treat PA as “every completed turn,” and AB as “official swings counted toward batting average.”
Misreading IP decimals
This is the #1 box score reading error. The decimal is outs, not tenths. Once a fan internalizes that 7.2 equals seven innings and two outs, pitching lines become far less confusing.
Treating pitcher wins as “best pitcher”
A win is partly timing. A pitcher can leave with a tie, then get credited with a win because the offense scored later. That’s why it helps to look at the whole pitching line rather than relying on the decision column.
Assuming errors always mean “bad defense”
Errors are judgment calls. Some borderline plays become hits, others become errors. A beginner should read errors as “a free opportunity occurred,” not as a complete evaluation of a player.
Real-World “Scan Method”: Read Any Box Score in 60 Seconds
10-second scan: line score + totals
Start with the inning flow, then glance at R/H/E. This reveals whether the game was a steady lead, a comeback, or a late collapse.
20-second scan: the two biggest offensive lines
Look for extra-base hits, RBIs, and high total bases. A single hitter can be responsible for the entire game’s scoring swing.
20-second scan: starter + biggest bullpen moment
Check IP and runs allowed to see whether the starter set the tone. Then identify the reliever who entered during the highest stress inning (often when inherited runners were on base).
10-second scan: LOB and E
LOB suggests missed opportunities. Errors explain extended innings and odd pitching lines. Together, they usually clarify why a game felt tense or sloppy.
Team/Franchise Examples to Make the Terminology Feel Familiar (USA Audience)
These examples are intentionally neutral and educational useful for recognizing patterns when scanning different matchups.
If reading a Yankees vs Red Sox box score
In a New York Yankees vs Boston Red Sox matchup, boxes often highlight late leverage relievers, pinch hitters, and defensive changes. Rivalry games can swing on one mistake, so readers often scan for a big inning, then check fielding notes.
A Dodgers vs Giants box score often highlights
A Los Angeles Dodgers vs San Francisco Giants box frequently emphasizes pitching matchups and situational scoring. Low-scoring games make sacrifice plays and bullpen usage feel more prominent in the final record.
Cubs vs Cardinals: traditional box score storytelling
A Chicago Cubs vs St. Louis Cardinals matchup is a classic setting for learning box score logic because the rhythm of the game often shows clearly: starter length, lineup turns, and late substitutions.
Braves vs Mets: lineup depth and bullpen decisions
An Atlanta Braves vs New York Mets box can make lineup construction feel real how the top of the order sets the table and the middle drives in runs, with bullpen choices deciding late innings.
Phillies vs Nationals: reading young pitchers and defense
A Philadelphia Phillies vs Washington Nationals box is a good place to practice spotting defensive impact (errors, DP opportunities) and seeing how a pitcher’s line changes when innings are extended.
Astros vs Rangers: power, extra-base hits, and leverage
A Houston Astros vs Texas Rangers box can be a quick lesson in how extra-base hits shift win probability without needing complicated math: one swing can rewrite the inning column.
Mariners vs Rays vs Guardians: run prevention clues
A Seattle Mariners vs Tampa Bay Rays or Cleveland Guardians box can teach run prevention scanning: WHIP and K/BB help show efficiency even when the final score is close.
White Sox, Tigers, Twins: spotting development signals
A Chicago White Sox, Detroit Tigers, and Minnesota Twins scan is useful for beginners learning how to spot improvement: fewer free base runners, cleaner innings, and defensive steadiness can show up subtly.
FAQs
1) What’s the fastest way to understand who won and why from a box score?
A beginner-friendly approach is to scan the line score first to find the “swing inning,” then confirm team totals (runs, hits, errors). After that, the two most important checks are the biggest run-producing hitter line (extra-base hits and RBIs) and the pitching line that shows who limited damage.
Many readers miss that a single late-inning bullpen moment can decide the game. When the story feels unclear, looking at left on base and errors often explains why a team had chances but didn’t convert.
2) Why do AB and PA not match for the same hitter?
They differ because plate appearances include outcomes that don’t count as at-bats. Walks, hit-by-pitch events, and some sacrifice plays are recorded as plate appearances but usually not at-bats.
That’s why a player can reach base multiple times while still having relatively few at-bats. For beginners, the simplest mindset is: plate appearances represent all completed turns at the plate, while at-bats represent the subset counted in traditional batting average math.
3) What does LOB tell a reader about a team’s offense?
Left on base captures how many base runners were stranded. A high number often indicates the offense created traffic but didn’t deliver hits in the highest-leverage moments.
It can also reflect double plays or strikeouts in key spots. LOB is not “always bad” some teams rack up LOB because they consistently get runners on base but it’s an excellent clue when the run total feels low compared to how many times a team reached base.
4) How should a reader interpret IP when it shows decimals like 6.2?
In baseball, the decimal in innings pitched represents outs, not tenths. A .1 means one out, and a .2 means two outs. So 6.2 means six full innings plus two outs in the next inning.
This notation is one of the most common beginner stumbling blocks because it looks like typical decimal math, but it isn’t. Once a reader internalizes this, pitching lines become dramatically easier to interpret.
5) What’s the difference between ER and UER?
Earned runs are runs the pitcher is considered responsible for under scoring rules, assuming normal defensive play. Unearned runs are tied to defensive errors or misplays that should have ended an inning.
A box score separates them because it tries to reflect responsibility fairly within official scoring. For beginners, the practical value is this: if a pitcher allowed multiple runs but many were unearned, the inning likely stayed alive due to an error, changing the shape of the game.
6) Is a pitcher with the win always the best pitcher in the game?
Not necessarily. The win is often influenced by timing and run support. A starter can pitch well but leave with a tie, while a reliever might pitch one inning and get credited because the offense scored immediately afterward.
That’s why readers should look beyond the decision column and check innings pitched, runs allowed, and efficiency indicators. If the goal is understanding performance, the full pitching line usually tells a more honest story than the win alone.
7) What does WHIP measure in simple terms?
WHIP is a simple measure of how many base runners a pitcher allows per inning through walks and hits. Lower WHIP generally suggests fewer opportunities for the opposing offense.
It doesn’t capture everything errors, hit-by-pitch events, and sequencing matter but it’s useful for quick scanning. For beginners, it’s best treated as an “efficiency flag”: a pitcher with a low WHIP usually kept the game calm, while a high WHIP often signals traffic and stressful innings.
8) How can a reader tell if a hitter had a powerful game without watching highlights?
A quick way is to scan for extra-base hits and total bases. Doubles, triples, and home runs usually show immediate impact, especially when paired with runs batted in.
Even if a hitter’s batting average line looks modest, a single big swing can decide the game. Another clue is whether that hitter scored runs or drove them in during the inning where the line score changed sharply. Power games often correspond directly to the “swing inning.”
9) What do PO and A mean on the fielding line?
Putouts and assists describe how defenders recorded outs. A putout is credited to the fielder who completes the out catching a fly ball or receiving a throw at first base.
An assist is credited to a fielder who contributes to the out fielding a ground ball and throwing to first, for example. Beginners can think of assists as “helped create the out” and putouts as “finished the out.” Middle infielders often accumulate assists because they handle many ground balls and relays.
10) How should a reader interpret double plays like 6-4-3 in the notes?
Those sequences use the position number system. A 6-4-3 double play means the shortstop (6) threw to the second baseman (4), who threw to the first baseman (3). Reading left-to-right shows the ball’s path.
The notation is valuable because it quickly communicates what happened without a long description. Once a beginner memorizes the 1–9 position map, these sequences become intuitive and actually speed up reading rather than slowing it down.
Author Bio
Author bio: Kenny writes beginner-friendly sports explainers that make stats feel simple and practical. Published by Ahmed Saeed.